

Seasonals short term headwind, but case for equities intact

We publish on a 3-day a week schedule:
SKIP MONDAY <– President’s Day Holiday
SKIP TUESDAY
Wednesday
SKIP THURSDAY
Friday
Click HERE to view our Inflation Dashboard.
While there has been some “hotter” inflationary economic data lately, it is too easy and tempting for the inflation-istas to jump on this and think inflation is surging ahead.
But the Fed is data dependent and not “data reactive” and unless the core drivers of inflation are roaring ahead—energy, housing and wages—the Fed is set to raise rates, but in a predictable path. This is what drives lower volatility and that is what allows multiples to expand this year.
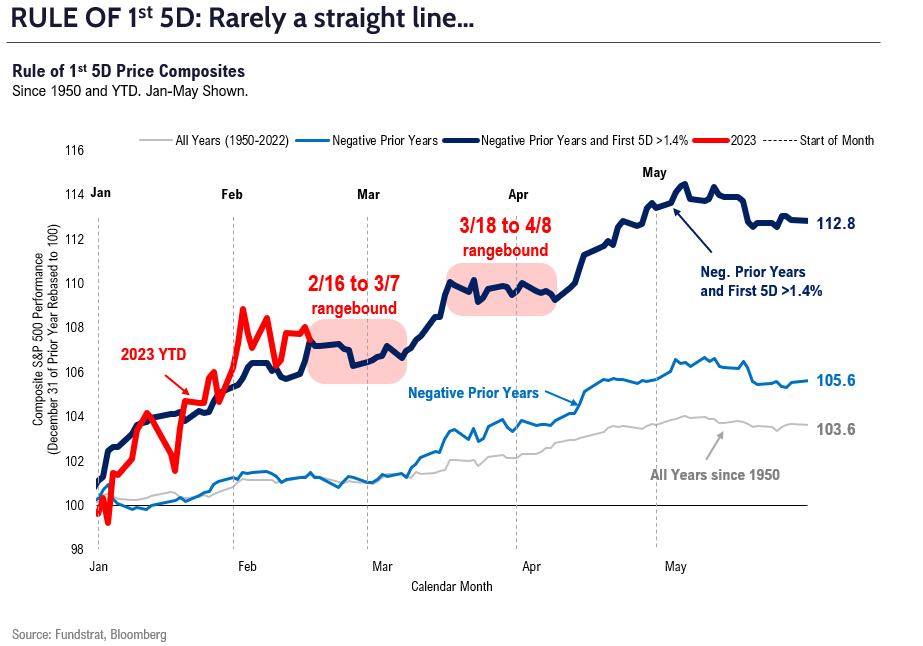
Our base case remains equities gain strongly in 2023, and the breadth expansion is supportive of this. As we noted in the past, there was a trifecta of factors on 1/12/2023 that have only been seen at major turning points in markets and this confirms our view that Oct 12, 2022 was the major low.
But we need to respect seasonals as well and as shown below, we think 2/16-3/7 remains a period where markets could stall. Below is a composite of the 7 precedent years where markets gained >1.4% on the “rule of 1st 5 days”
- just a rough sketch but highlights that equities are probably going to need to digest the strong gains seen in the first 6 weeks of this year.
TACTICAL: Feb shaping up to be tough month
In the shorter term, we think January borrowed from February. As shown below, in those years when markets are up >5% thru day 25 (like 2023), into month-end:
- win-ratio into month-end is only 53% and is lower than 67% for other months
- so, Jan strength borrowed from February
- but it doesn’t change the positive outlook into YE

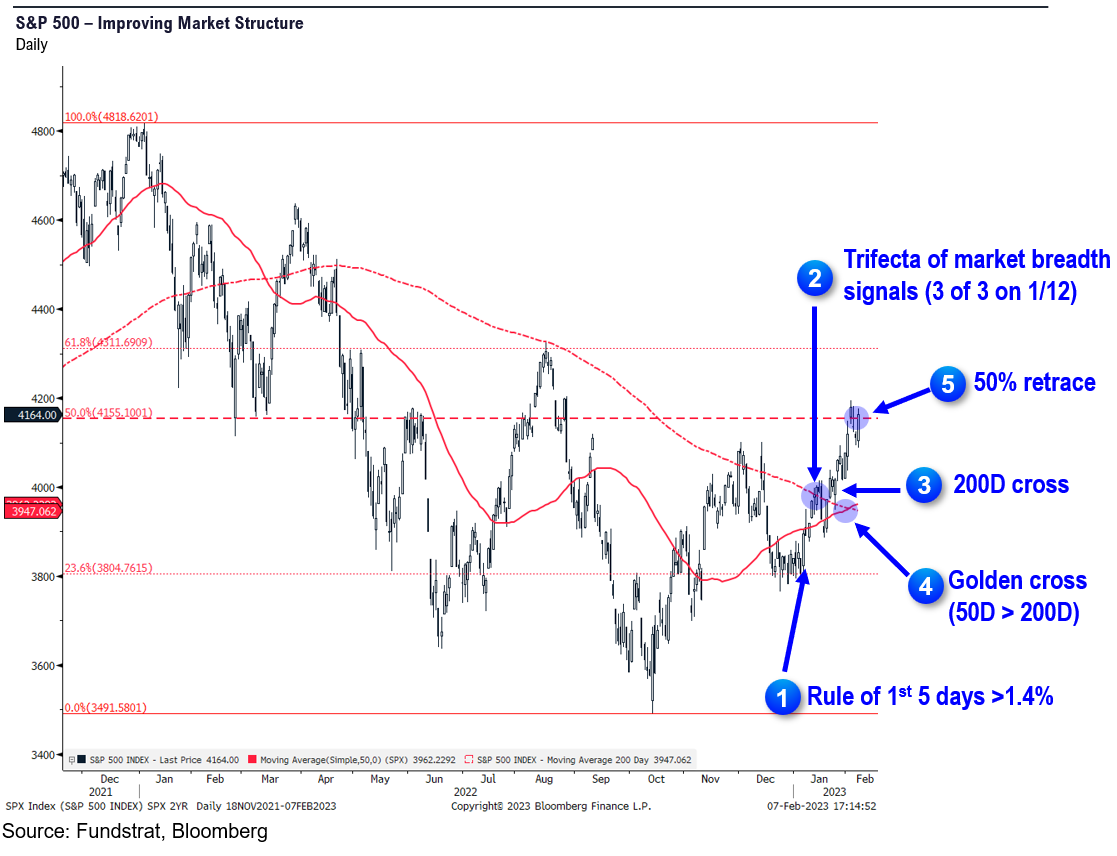
MARKET STRUCTURE: Vast improvement in market structure – 5 SIGNALS now
Lastly, the S&P 500 has seen vast improvements in market structure. This is something that Mark Newton, our Head of Technical Strategy at Fundstrat, has been commenting upon. Take a look:
- on 1/9/2023, the “rule of 1st 5 days >1.4%” triggered
- on 1/12/2023, the trifecta of market breadth triggered, first time EVER since 1950 (see past reports)
- on 1/23/2023, the 3rd day S&P 500 close >200D, first time since Jan 2022
- on 2/2/2023, S&P 500 “golden cross” where 50D > 200D, first time since March 2022
- on 2/7/2023, S&P 500 closed above 50% retracement of entire decline for 2nd day
The list is growing to validate that internal market structure of S&P 500 is vastly improving.
STRATEGY: Technology is primary beneficiary of Fed “course correction”
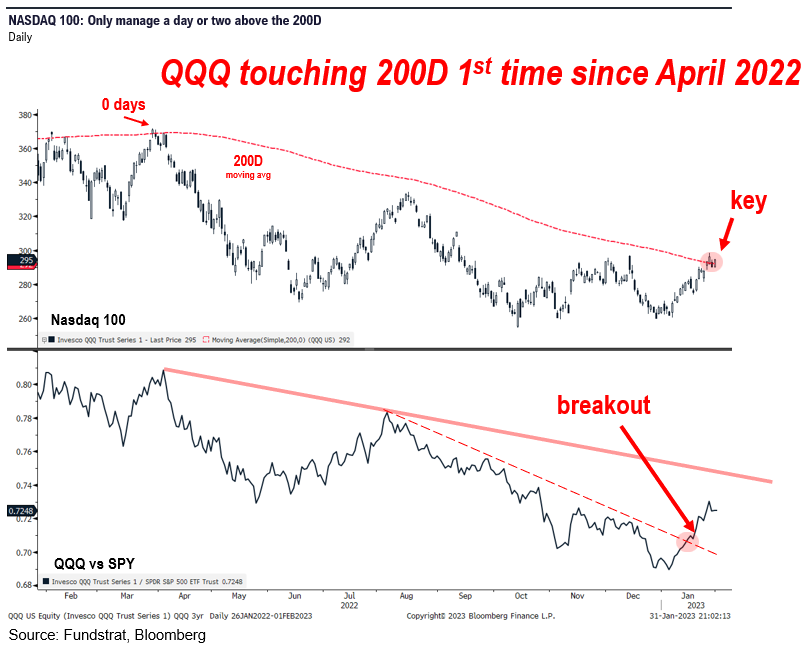
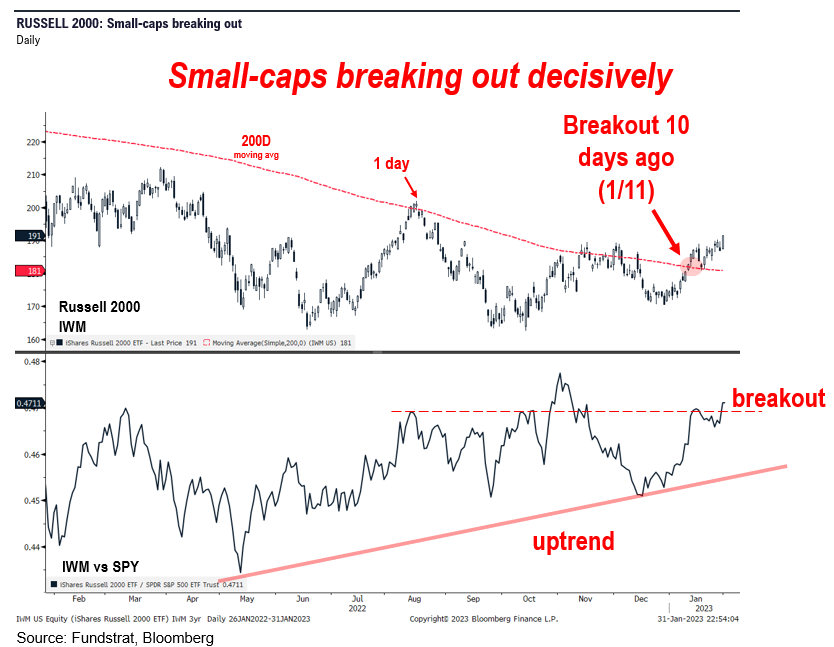
The best way to play easing financial conditions, in our view, is owning Technology and even small-caps. As the charts below highlight, both QQQ -0.07% and IWM 0.05% are breaking out decisively
- IWM is more evident as the breakout was 1/11
- QQQ breaking out on a relative basis and just crossed above the 200D
And Technology remains a group where there are many down and out names.
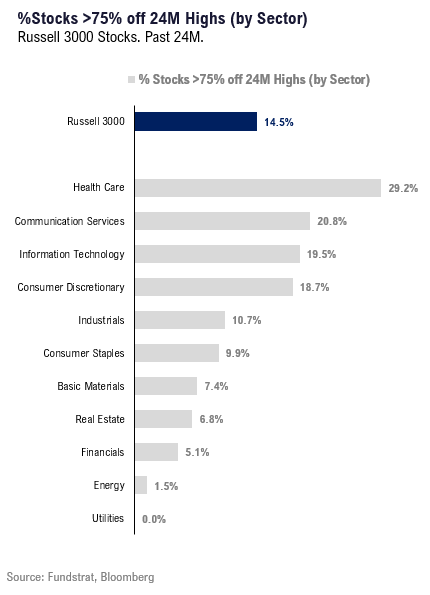
- ~20% of Technology stocks in the broad market index Russell 3000 are >75% off their highs
- That means 1 in 5 technology stocks has been absolutely obliterated
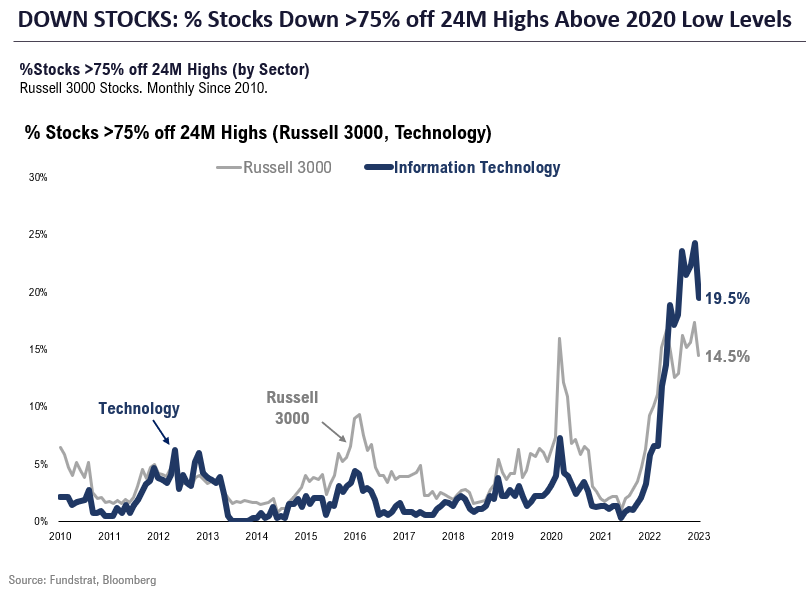
And as shown below, there is a greater bludgeoning in Healthcare and Comm Services (which is essentially TMT).
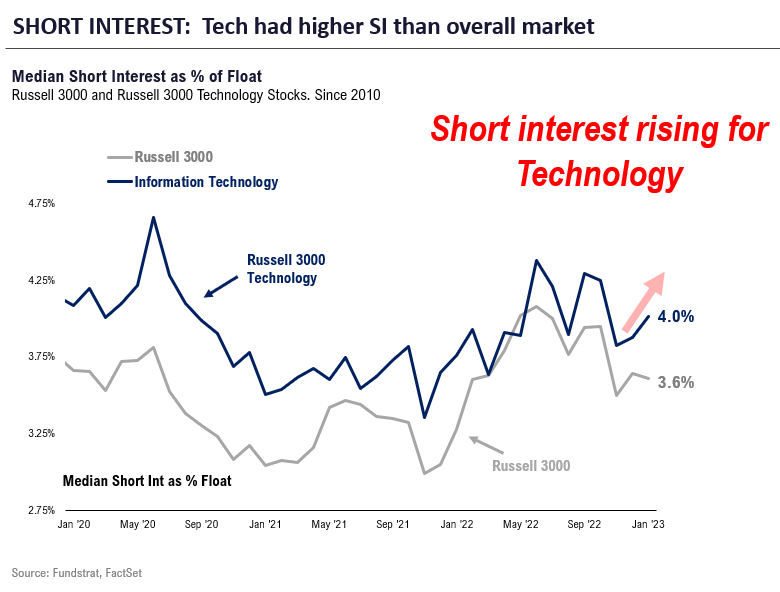
Similarly, short interest has been rising in Technology. So this rally YTD has been met with investor skepticism and they are increasing their short selling of Technology. To me, this is fuel for further upside.
Technology largest beneficiary of easing FCIs and less correlated to PPI
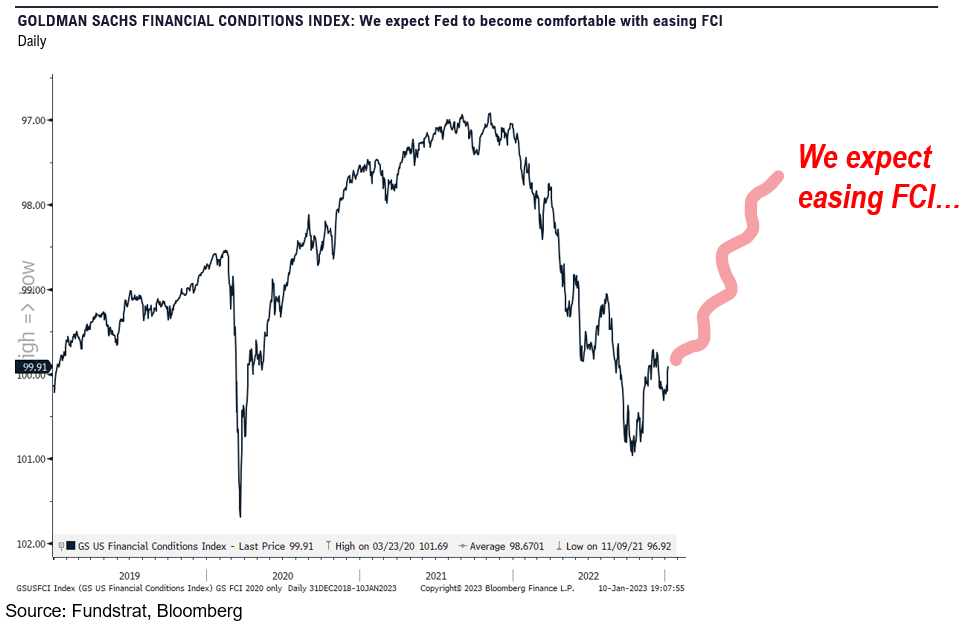
The two big macro changes to impact 2023, in our view, are:
- easing of financial conditions, of FCIs
- easing of PPI, or easing of cost pressures for producers
- some sectors are negatively impacted by falling PPIs as this spells margin pressure
As shown below, Technology is arguably the greatest beneficiary of each:
- Technology at 88% has the highest correlation to easing FCIs
- and has less exposure to PPIs falling as margin correlation is only 28%

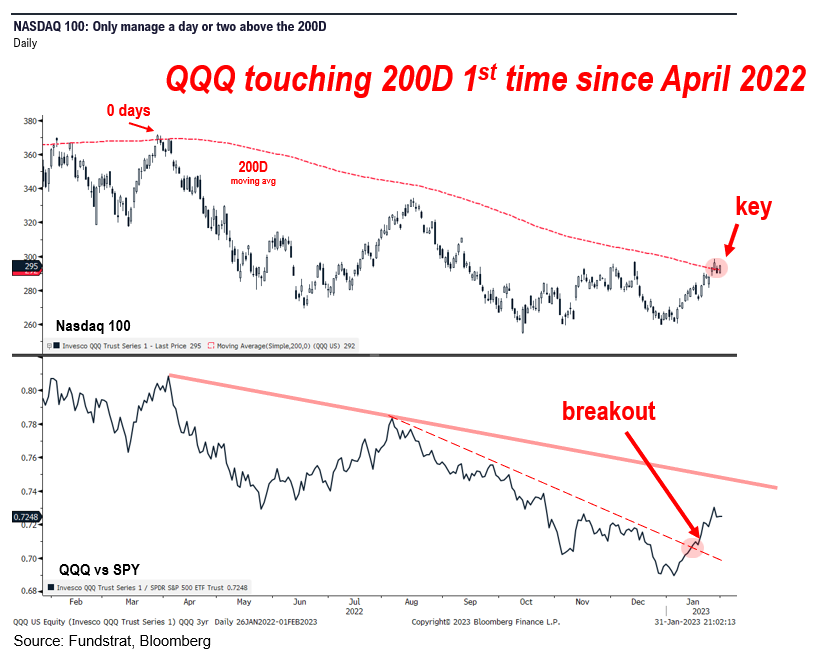
Moreover, Technology technicals seem to be improving:
- QQQ -0.07% relative performance of SPY broke above a key trendline
- and QQQ is now closed above the 200D for the first time since April 2022
- So the technical picture has flipped positive
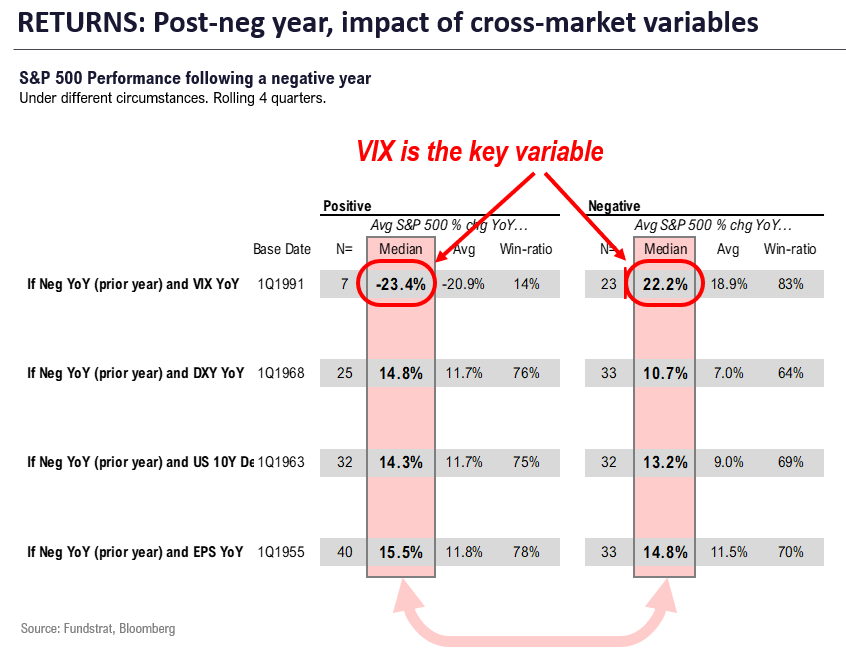
STRATEGY: VIX matters far more for 2023 returns than EPS growth
Our data science team compiled the impact on 2023 equity returns from variables:
- S&P 500 post-negative year (2022)
- the varying impacts of
- VIX or volatility
- USD change
- Interest rates
- EPS growth
- All of the 4 above, positive or negative YoY
- Data is based on rolling quarters and summarized below
The surprising math and conclusions are as follows:
- most impactful is VIX
- Post-negative year (rolling LTM)
- if VIX falls, equity gain is 22% (win ratio 83%, n=23)
- if VIX rises, equity lose -23% (win ratio 14%, n=7)
- I mean, this shows this all comes down to the VIX
- EPS growth has little impact
- If EPS growth is negative YoY (likely), median gain +14.8% (win-ratio 70% n=33)
- If EPS growth is positive YoY, median gain is 15.5% (win-ratio is 78%)
- Hardly a sizable bifurcation
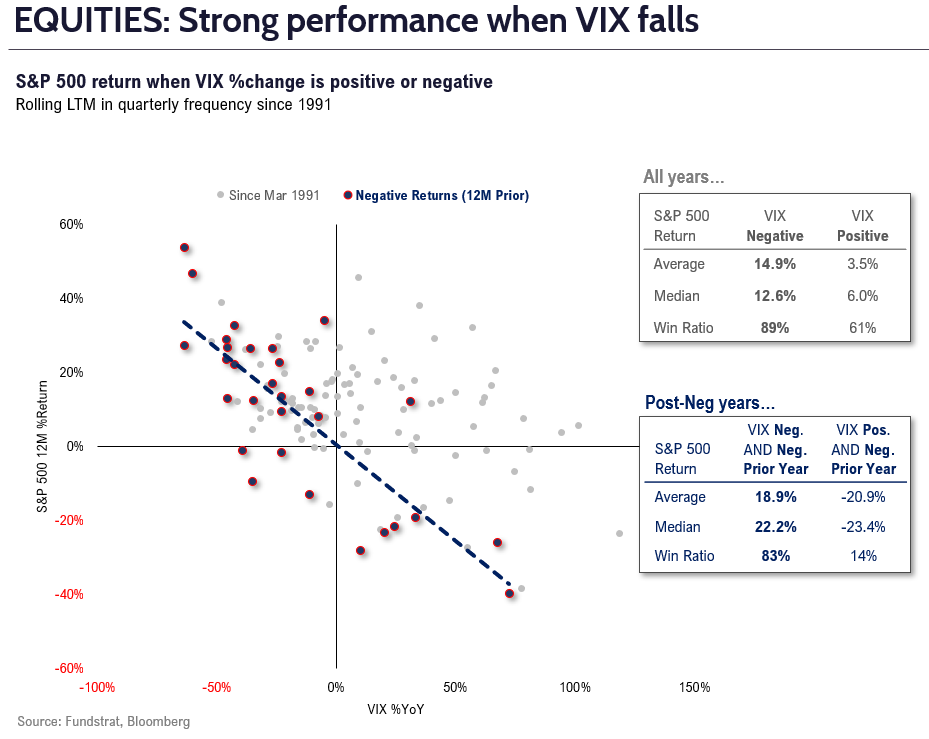
As the scatter below highlights, we can see the sizable influence of the VIX. Even in all years, the VIX is a key factor:
- in our view, if inflation falls sharply
- and wage growth slows
- Fed doesn’t have to cut, but this is a dovish development
- we see VIX falling to sub-20
- hence, >20% upside for stocks
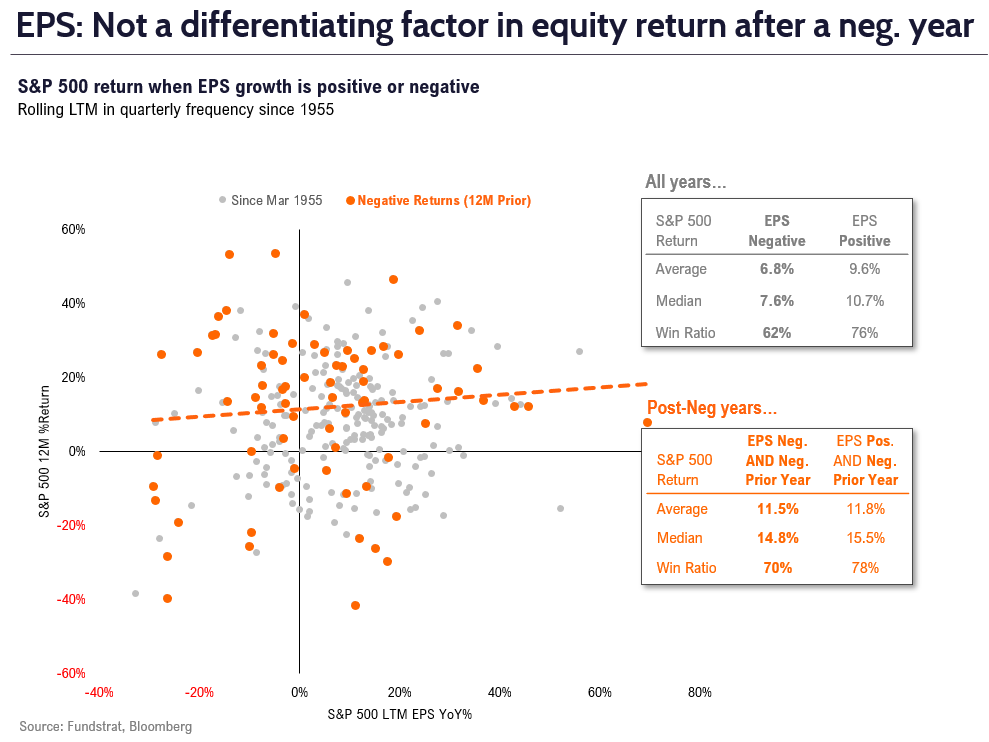
And as shown below, EPS growth has a somewhat important correlation, but hardly as strong as VIX changes.
- the difference in median gain is a mere 70bp (positive vs negative) post-negative year
- the importance of EPS growth is stronger in other years
STRATEGY: Financial conditions should ease in 2023, driving higher equity prices. Technology, Discretionary and Industrials levered to easing FCI
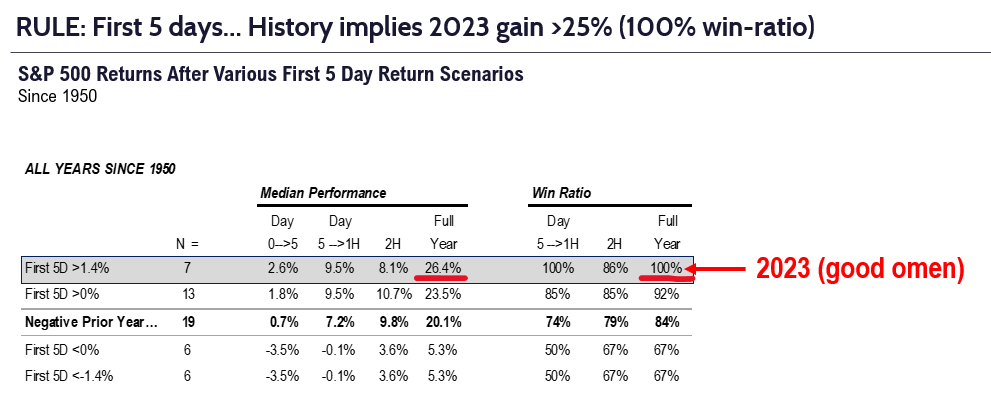
The “base” case for 2023 should be below. That stocks gained >1.4% in the first 5 trading days, and this portends strong gains for the full year:
- Post-neg year + up >1.4% on first 5 days
- Day 5 to first half median gain is 9.5%
- Full year median gain is 26%, implies >4,800 S&P 500
- 7 of 7 years saw gains.
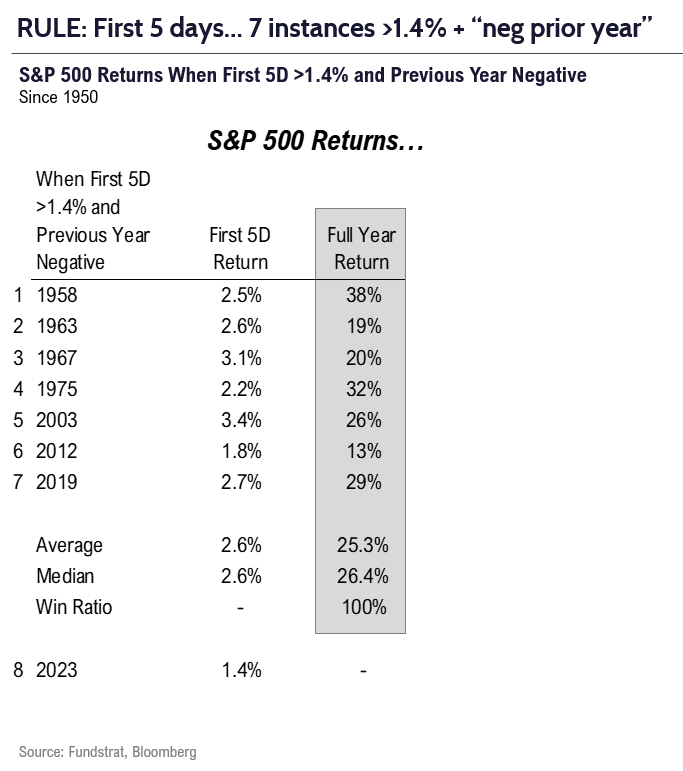
Those 7 precedent years are shown below.
- the range of full year gains is +13% to +38%
- so, this is a VERY STRONG signal
- the two most recent are 2012 and 2019
- we think 2023 will track >20%
The path to higher equity prices is discussed above:
- core inflation falling faster than Fed and consensus expects
- wage inflation is already approaching 3.5% target of Fed (aggregate payrolls)
- Fed could “dovishly” leg down its inflation view
- allowing financial conditions to ease
- bond market has already seen this and is well below Fed on terminal rate
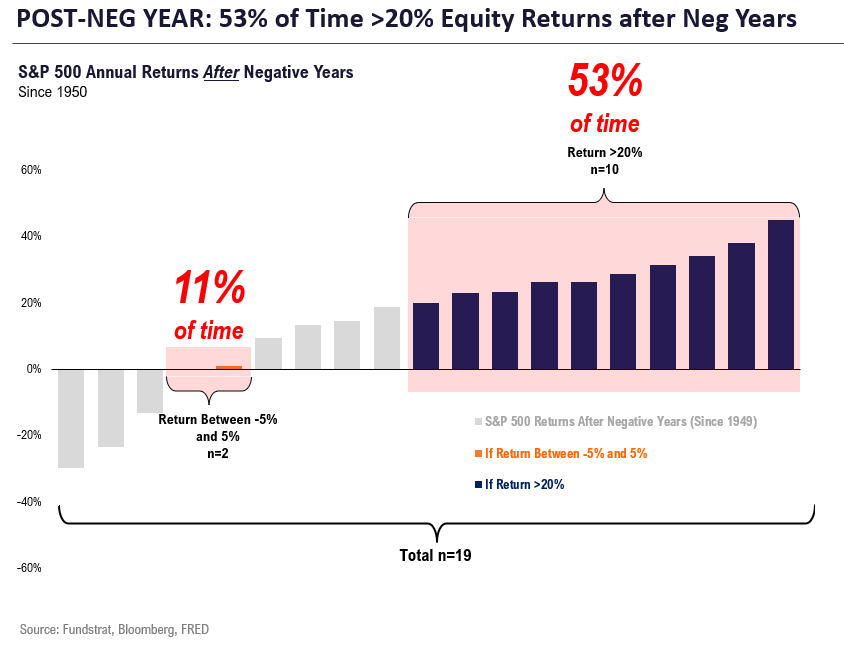
BASE CASE: The “maths” for what to expect in 2023, post a “negative return” year (2022)
Question: how common is a “flat” year? Our team calculated the data and it is shown below:
- since 1950, there are 19 instances of a negative S&P 500 return year. In the following year,
- stocks are “flat” (+/- 5%) only 11% of the time (n=2)
- stocks are up >20% 53% of the time (n=10)
- yup, stocks are 5X more likely to rise 20% than be flat
- and more than half of the instances are >20% gains
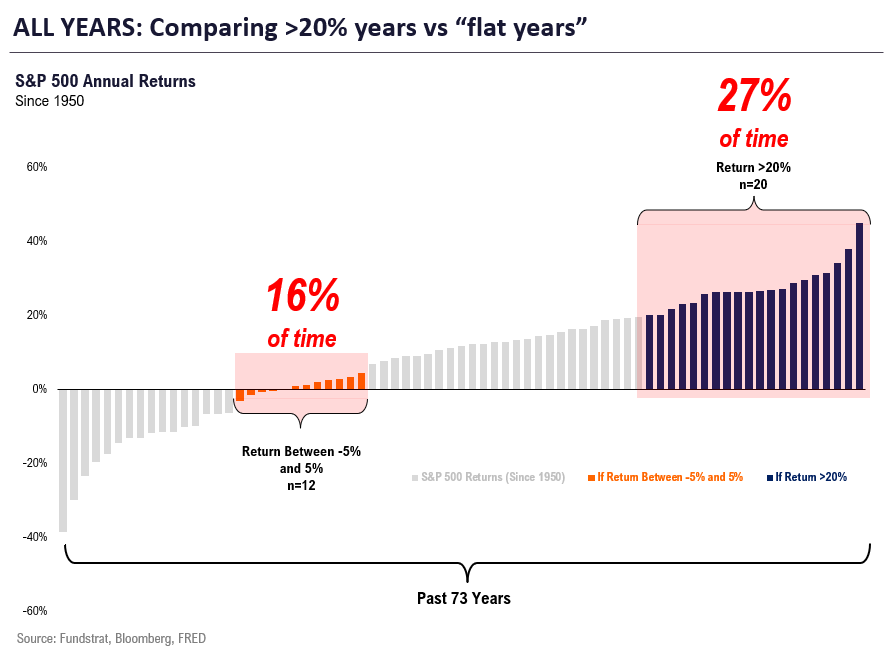
So, does a “flat year” still make sense?
As shown below, these probabilities are far higher compared to typical years:
- since 1950, based upon all 73 years
- stocks are “flat” 16% of the time vs 11% post-negative years — BIG DIFFERENCE
- stocks are up >20% 27% of the time vs 53% post-negative years — BIG DIFFERENCE
- see the point? The odds of a >20% gain are double because of the decline in 2022
_____________________________
37 Granny Shot Ideas: We performed our quarterly rebalance on 1/30. Full stock list here –> Click here
______________________________

